Created in 2008, Whatthemovie is a unique movie quiz game where people upload movie stills and the others have to guess from what movie the image was taken. In more than ten years, the website have accumulated more than 470 000 images from 30 000 movies uploaded by our awesome users.
We favor quality over quantity. Therefore, not all images submitted are accepted. We could have more than a million images today but that was not our priority. The images uploaded must be interesting for the quiz and the quiz itself should stay quite balanced in terms of difficulty and movie genres.
The main area looks like this:

You are given an image taken from a movie scene and you have to guess the movie’s title. The flags mean you don’t have to enter the original title to get points — you can also write it in German, French, Spanish etc. We support a lot of languages for alternative titles to let users from all around the world the possibility to play and compete with the rest of the users.
# Improve the uploading stage
Uploading new movie stills on the website may sound easy: you pick a movie from our database — or add a new one — , you upload your image and you’re good to go. In reality, users have first to take a snapshot by themselves from a movie with any player available, crop the potential black bars of the image and go through the uploading stage described above.
On the last step of the uploading stage, we ask our users to add tags that describe what the image contains, what’s inside — does the image show a street, a car etc. It looks relatively easy too but with all the work they have to go through already, most of our uploaders don’t bother adding tags which is unfortunate because relevant tags are important to filter shots.
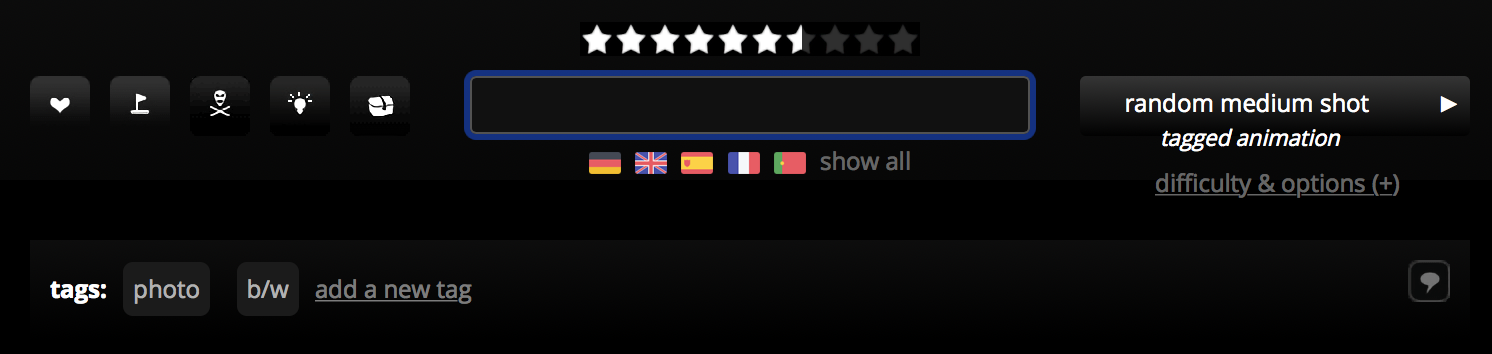
Filtering black and white snapshots might not sound interesting but think about other tags like “gore”, “nudity” or “blood”. These tags show obviously sensitive content and some users don’t want to see these images — at least without asking them first. That’s why tagging images is important. If a user forgets to add the “nudity” or “gore” tag on his shot, a user playing from work — a lot are! — could potentially see this image and nobody wants that to happen in an open plan.
In fact, we have added a setting on the website to let users choose if they want this kind of snapshots to be displayed automatically or not. But obviously, if a snapshot has not been tagged as sensitive — “gore” or “nudity” — , it will still show up.
Which leads us to our project today: can we suggest tags to users in an automatic way when they upload their snapshots? Can we build an AI capable of detecting relatively common elements in an image to help people tagging their shots? Can we detect nudity or gore material in an image to prevent sensible people to see them?
In this first part of our series, we will start by creating a dataset from our database and clean it with Pandas. Then, in the second article, we will start training an AI using FastAI and try to optimize it to get the best results we can when predicting elements in images.
# From MariaDB to Pandas
Our website is powered by Ruby on Rails which makes database structure quite easy to create, understand and maintain. In all the datas we have at disposal for this project, we are actually only interested in two tables: the “shots” table and the “tags” table. These tables have all the datas we need. The former has the image ID and its filename. The latter has all tags added to a specific “refID” — in our case, our image ID.
There are several ways to export these tables in a format we care about. Pandas, the library we are going to use to prepare the datas to train our AI, can read several file types such as CSV files. That’s fortunate since PhpMyAdmin has the hability to export tables straight to CSV files.
PhpMyAdmin is a nice way to do the conversion, but we prefer to do the export through the command line to have our CSV files directly on the server. Let’s use mysqldump to export our two tables to SQL files first:
$ mysqldump -u root -p wts shots > shots.sql
Enter password:
$ mysqldump -u root -p wts tags > tags.sql
Enter password:
$ ls *.sql
shots.sql tags.sql
Now that we have the tables exported, we can convert them to CSV files using this great Python script made by James Mishra:
$ wget -q https://raw.githubusercontent.com/bmtgoncalves/mysqldump-to-csv/master/mysqldump_to_csv.py
$ python mysqldump_to_csv.py shots.sql > shots.csv
$ python mysqldump_to_csv.py tags.sql > tags.csv
$ ls *.csv
shots.csv tags.csv
We are now ready to work with Pandas!
# Prepare and clean our datas with Pandas
We now have our datas in the good format. We can start using Pandas to explore the datas, keep only the columns of our tables that we are interested in and merge the two tables to get a pretty nice dataset ready to train our AI.
The best way to install Pandas and use it is to install Anaconda. It is a great package that ships by default with a lot of librairies used in Deep Learning such as Pandas. You can find how to install it on this page.
Another advantage to install Anaconda is Jupyter which is included by default as well. Jupyter lets you do some Python, Pandas and Machine/Deep Learning coding directly in the browser which is quite convenient because you can then create and display, for example, charts of your datas to check what it shows, take better decisions of what to keep etc. Starting Jupyter is easy as typing `jupyter notebook in the terminal once installed.
# Load the datas
Let’s start coding! Once we have started Jupyter, we have to import the libairies we need — in this case, Pandas, Numpy and Matplotlib.
import pandas as pd
import numpy as np
import matplotlib.pyplot as plt

# show graphs in jupyter
%reload_ext autoreload
%autoreload 2
%matplotlib inline

# display all columns/rows and what's inside
pd.set_option('display.max_rows', 500)
pd.set_option('display.max_columns', 500)
pd.set_option('display.width', 150)
We can now open our CSV files with Pandas and start digging. Let’s open the “tags” table first.
tags = pd.read_csv('tags.csv')
tags.head()
| id | value | ref_id | user_id | created_at | updated_at | type |
|---|---|---|---|---|---|---|
| 265 | pink panties | 2 | 6847.0 | 2009-05-29 15:00:57 | 2009-05-29 15:00:57 | ShotTag |
| 268 | tennis | 3 | 6847.0 | 2009-05-29 15:03:33 | 2009-05-29 15:03:33 | ShotTag |
| 274 | casino chip | 7 | 6847.0 | 2009-05-29 15:07:55 | 2009-05-29 15:07:55 | ShotTag |
| 277 | wooden rabbit | 8 | 6847.0 | 2009-05-29 15:08:54 | 2009-05-29 15:08:54 | ShotTag |
| 282 | blindfolded man | 9 | 6847.0 | 2009-05-29 15:10:12 | 2009-05-29 15:10:12 | ShotTag |
With .head(), we can see the first rows of our table and its structure directly in Jupyter.
The first thing we can do here is to remove the columns we don’t need. The “tags” table contains the value of the tag, the ID of the shot the tag is linked to — ref_id — and the user who added it. The columns created_at and updated_at are automatically generated by Ruby on Rails when you create new tables through their generators.
Let’s only keep the id, value and ref_id columns:
tags.drop(['user_id', 'created_at', 'updated_at', 'type'], axis=1, inplace=True)
tags.set_index('id', inplace=True)
tags.head()
| id | value | ref_id |
|---|---|---|
| 265 | pink panties | 2 |
| 268 | tennis | 3 |
| 274 | casino chip | 7 |
| 277 | wooden rabbit | 8 |
| 282 | blindfolded man | 9 |
Only keep the values we care about!
Our goal is in this project is not to find every possible element in an image but to identify the most common elements or, to be more precise, the most used tags on the website. We can find that quite simply with Pandas and the .value_counts() function:
top_tags = tags.value.value_counts().iloc[:400]
pd.DataFrame(top_tags)
| rank | tag | count |
|---|---|---|
| 1. | b/w | 41 903 |
| 2. | animation | 16 865 |
| 3. | text | 12 638 |
| 4. | nudity | 8882 |
| 5. | Awesome Upload | 8634 |
| 6. | car | 7036 |
| 7. | character shot | 5227 |
| 8. | gore | 5096 |
| 9. | woman | 4671 |
| 10. | man | 4639 |
Some of the most-used tags on the website.
Showing the top 400 tags used here will be overkill but we can already find some datas to clean in these first results. We can see that in the 5th position, we have the tag “Awesome Upload” or, in the 13th position, we have the “SotD” tag. These tags are useless in our case because there are tags that don’t describe what’s on the image. In fact, they are related to the website’s system.
A shot with a “Awesome Upload” tag means it was uploaded by a premium user and in that case, the image is automatically accepted, there is no vote, no selection. Therefore, we don’t want to keep this tag and try to suggest it on a new uploaded image — it is already done automatically.
The same applies to the “SotD” tag — which means “Snapshot of the Day”. Every day, the best rated shot gets rewarded, promoted, and the uploader as well. It doesn’t describe anything in the snapshot so we don’t want it.
Another interesting one is the “couple” tag. A couple is very hard to recognize. It could be two men, two girls, a man and a girl etc. Also, how and when do we decide to apply this tag? When people are close to each other? Kissing? Hugging? It’s hard to see the difference.
More importantly, since our website is a quiz game, it’s important that tags must only describe what the image shows. Tags should not give away any hint about the movie we are trying to guess. If an uploader — who obviously has watched the movie — adds the “couple” tag, it gives away some information about the movie and we don’t want that. If we see two people kissing, it doesn’t mean they are a couple, neither if they are close to each other.
# Get rid of tags we don’t want to suggest
Before removing tags, we can merge tags that are very similar. For example, we have shots with the “phone” tag or the “telephone” one. Since it describes the same thing, we can merge them into a single one, “telephone”:
tags['value'] = tags['value'].apply(lambda x: x if not x == 'phone' else 'telephone')
We also do the same process for other tags such as “airplane” and “plane” or “redhead” and “red hair” and we drop the potential duplicates found in the table afterwards to be sure everything is clean:
tags.drop_duplicates(['value', 'ref_id'], inplace=True)
For this project, we decided to keep tags that were at least added more than 500 times and exclude some tags like the ones described above. Pandas provides a convenient function to check if a column’s value is part of a list of different values — and keep only these ones. Here, we want the opposite. We want to exclude a list of tags from our dataset. We can use the .isin() function that normally gives back only the rows where the value matches one of the elements of a list. But if we add ~ in front of the function, it will do what we are looking for, exclude a list of tags — like a isNOTin() function.
top_tags_name = top_tags[top_tags >= 500].index
exclude_tags = ['Awesome Upload', 'SotD', 'SotM', 'SotY',
                'replaceplease', 'unsolved', "Zo0's eye series",
                'not that one', 'upside down', 'hanging',
                'couple', 'close-up', 'animated']
top_tags_name_cleaned = top_tags_name[~top_tags_name.isin(exclude_tags)]
After this operation, we have 183 different tags left. We can now keep only the rows in our “tags” table that contain one of them with the .isin() function:
tags_cleaned = tags[tags['value'].isin(list(top_tags_name_cleaned.values))]
Our “tags” table is now ready to be merged!
# Merge the “tags” table with the “shots” table
Now that we have cleaned our “tags” table and kept only the most-used and interesting tags, we have to use Pandas to create a unique table that contains the tags and the image datas. We know that the ref_id column in the “tags” table refers to the the id of an image in the “shots” table. Pandas makes it easy to merge two different tables that have a “key” in common with the merge function.
Let’s first load and check the structure of our “shots” table:
shots = pd.read_csv("shots.csv")
# only keep columns we care about
shots = shots[['id', 'movie_id', 'queue', 'shot_image_id']]
shots.head()
| id | movie_id | queue | shot_image_id |
|---|---|---|---|
| 1 | 1 | 3 | 1 |
| 2 | 2 | 3 | 81091 |
| 3 | 3 | 3 | 81021 |
| 4 | 4 | 3 | 80993 |
| 6 | 6 | 3 | 82384 |
A few columns of our “shots” table.
The only columns we care about here are the id column — which refers to the shot ID on the website — , and the shot_image_id column that stores the filename of the movie snapshot. It’s time to merge both tables! As we know already, we have a key in common between these two tables so it’s going to be easy.
Let’s use Pandas to do the work:
merged_data = pd.merge(shots, tags_cleaned, left_on=['id'], right_on=['ref_id'])
merged_data.head()
| id | movie_id | queue | shot_image_id | value | ref_id |
|---|---|---|---|---|---|
| 1 | 1 | 3 | 1 | statue | 1 |
| 2 | 2 | 3 | 81091 | bed | 2 |
| 2 | 2 | 3 | 81091 | legs | 2 |
| 2 | 2 | 3 | 81091 | text | 2 |
| 7 | 7 | 3 | 250992 | hand | 7 |
Both tables have been merged into one.
After merging the datas, we are going, once again, to remove all the columns we are not interested in for our final dataset. But we’re also going to regroup all the tags into a single cell for each image. For example, you can see above that the image with the id “2” have three different rows meaning it has three different tags associated to it — “bed”, “legs”, “text” in the value column.
We’re going to regroup all the tags for a given image in a single cell separated by a comma:
# regroup tags for a given image into one cell
tags_grouped = merged_data.groupby(['ref_id', 'shot_image_id'])['value'].apply(lambda x: ','.join(list(x)))

# change table's index
tags_grouped = pd.DataFrame(tags_grouped).reset_index()
tags_grouped.set_index('ref_id', inplace=True)
tags_grouped.index.names = ['id']

# rename columns
tags_grouped.columns = ['shot_image_id', 'tags']
tags_grouped.head()
| id | shot_image_id | tags |
|---|---|---|
| 1 | 1 | statue |
| 2 | 81091 | bed, legs, text |
| 7 | 250992 | hand, text |
| 8 | 81360 | castle, sky |
| 10 | 9 | water, redhead |
Our final table: an image ID and its tags.
For clarity purpose, we also have renamed the column containing the tags to tags, set the column ref_id as index and renamed it to id. Good, now our dataset is ready to train our AI! By using .shape, we see that we have 243 558 images in our dataset with at least one associated tag to it and 183 different labels.
The last thing to do is to export our dataset to a CSV file:
tags_grouped.to_csv('dataset.csv')
# What’s next
In this first article of our series, we created our own dataset from scratch using Pandas. After cleaning it and keeping only useful datas, it is now time to start thinking about how to use this dataset to create and train an AI capable of distinguishing different elements in movie snapshots and suggest these elements as tags to users. That will be the theme of our second article. Stay tuned!